Read the result columns before the popularity columns when comparing MARVEL SNAP Draft starters. How often a trio finishes a run with five wins, how many wins it averages, and how often players choose it answer different questions. A popular choice can still be a poor fit for the draft you want to play.
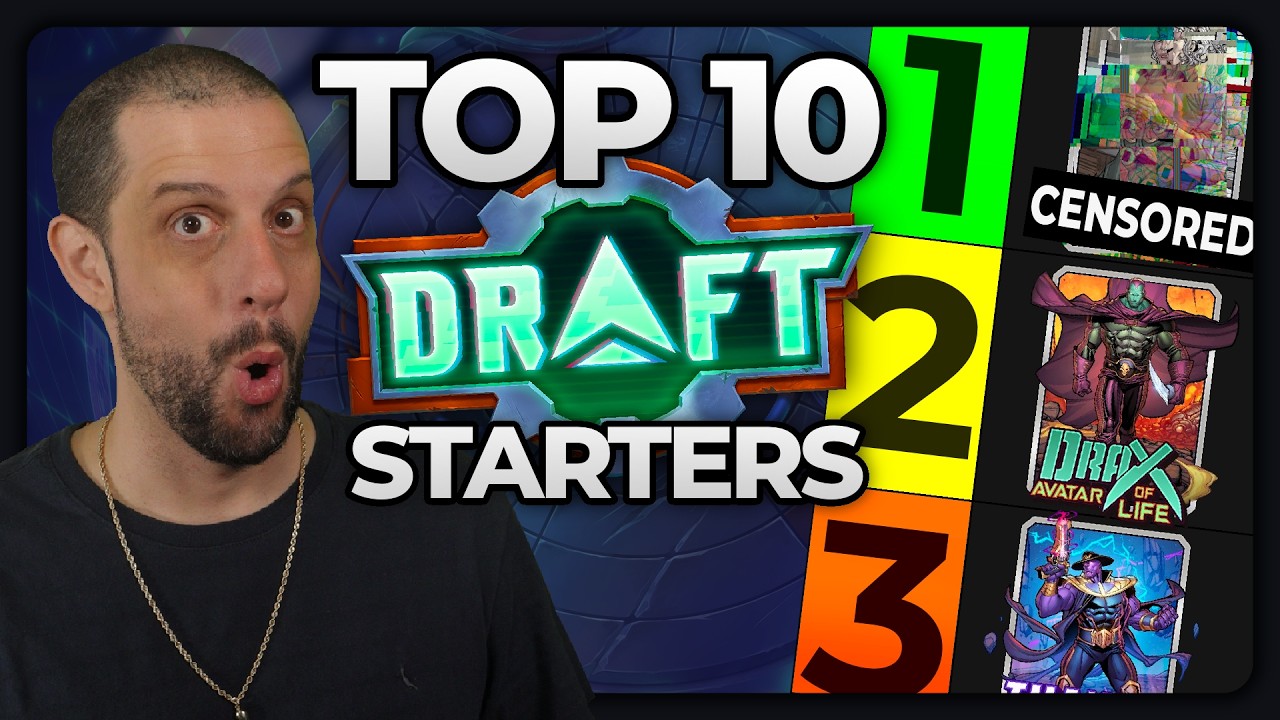
In the August 25 starter video, I weighed both five-win finishes and average wins. The useful part of that method survives a changing tier list: understand what each number measures before letting it make the pick for you. The figures below are examples from that early snapshot, not a current starter ranking.
What the Draft columns tell you
The August 25 explanation of the statistics separates four measurements:
| Measurement | What is being counted | What it helps you judge |
|---|---|---|
| Five-win finish rate | The share of recorded runs with that starter that reached five wins | How often those runs reached the finish being measured |
| Average wins | Total wins across recorded runs with that starter, divided by those runs | The average result across successful and unsuccessful runs |
| Pick rate when offered | How often players selected that starter when it was available to choose | How attractive players found it among their offers |
| Overall popularity | That starter's share of selections across all starter picks | How much of the selected field it represented |
The denominator is the group underneath the percentage. Changing that group changes the meaning. The people offered a particular trio are a different group from everyone who picked any starter.
Keep run results separate from individual match results, too. A five-win finish rate is about complete runs. Reading it as the chance to win your next match gives the number a job it cannot do.
Read the Lasher example without mixing the numbers
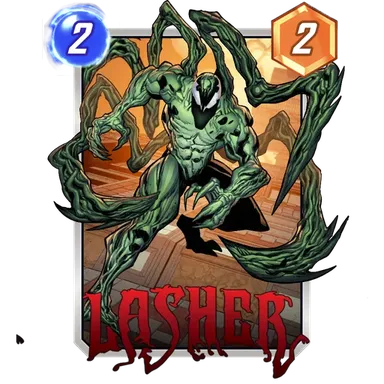
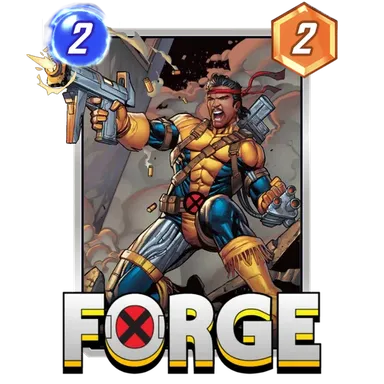
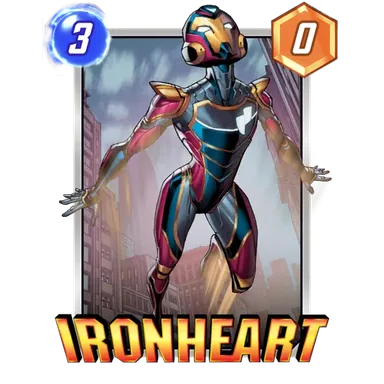
The video described the Lasher, Forge, and Ironheart starter with a 44% five-win finish rate, 3.45 average wins, and a 38.7% pick rate when offered in that August 25 snapshot.
Those numbers can all be true at once. The 44% described how often recorded runs reached five wins. The 3.45 included the results of runs that finished earlier. The 38.7% described player selection when the trio appeared as an option.
None of those figures says that you personally have a 44% chance to finish your next run with five wins. Your later picks and play decisions still matter. The table records what happened across the tracked runs; it does not finish your draft for you.
Why a rare starter can be popular when offered
Later in the same video, the Black Panther starter example had roughly 5% overall popularity while being selected more than 75% of the time it was offered. There is no contradiction. A starter can appear infrequently and still be a pick that players usually take when they see it.
That is why low overall popularity alone is a bad reason to dismiss an offer. It can reflect limited exposure. Equally, a high offered-pick rate tells you players wanted the starter; you still need its results to assess how those choices worked out.
Check the date before trusting the order
The August 28 Snapcast challenged how well opening-day impressions would hold up. The discussion considered changes in who was playing and how quickly players learned the mode. Its ticket and bot explanations were hypotheses and personal observations, not a verified matchmaking formula.
The practical lesson is to check the time period and the amount of data behind the result. If a comparison does not show its sample, you cannot tell from the percentage alone how much evidence supports a small gap. Our Golden Gauntlet discussion offers another example of reading results in their competitive context.
Before choosing, put the offered starters side by side using the same period and the same measurement. Then connect those results with the plans in our Draft starter packs and archetypes guide. The useful final question is whether you understand how that trio starts a workable draft, including what you will still need to find.